Why didn't I know about machma?!
June 7, 2017
0 comments Linux, MacOSX, Go
"machma - Easy parallel execution of commands with live feedback"
This is so cool! https://github.com/fd0/machma
It's a command line program that makes it really easy to run any command line program in parallel. I.e. in separate processes with separate CPUs.
Something network bound
Suppose I have a file like this:
▶ wc -l urls.txt
      30 urls.txt

▶ cat urls.txt | head -n 3
https://s3-us-west-2.amazonaws.com/org.mozilla.crash-stats.symbols-public/v1/wntdll.pdb/D74F79EB1F8D4A45ABCD2F476CCABACC2/wntdll.sym
https://s3-us-west-2.amazonaws.com/org.mozilla.crash-stats.symbols-public/v1/firefox.pdb/448794C699914DB8A8F9B9F88B98D7412/firefox.sym
https://s3-us-west-2.amazonaws.com/org.mozilla.crash-stats.symbols-public/v1/d2d1.pdb/CB8FADE9C48E44DA9A10B438A33114781/d2d1.sym
If I wanted to download all of these files with wget the traditional way would be:
▶ time cat urls.txt | xargs wget -q -P ./downloaded/
cat urls.txt  0.00s user 0.00s system 53% cpu 0.005 total
xargs wget -q -P ./downloaded/  0.07s user 0.24s system 2% cpu 14.913 total

▶ ls downloaded | wc -l
      30

▶ du -sh downloaded
 21M    downloaded
So it took 15 seconds to download 30 files that totals 21MB.
Now, let's do it with machama instead:
▶ time cat urls.txt | machma -- wget -q -P ./downloaded/ {}
cat urls.txt  0.00s user 0.00s system 55% cpu 0.004 total
machma -- wget -q -P ./downloaded/ {}  0.53s user 0.45s system 12% cpu 7.955 total
That uses 8 separate processors (because my laptop has 8 CPUs).
Because 30 / 8 ~= 4, it roughly does 4 iterations.
But note, it took 15 seconds to download 30 files synchronously. That's an average of 0.5s per file. The reason it doesn't take 4x0.5 seconds (instead of 8 seconds) is because it's at the mercy of bad luck and some of those 30 spiking a bit.
Something CPU bound
Now let's do something really CPU intensive; Guetzli compression.
▶ ls images | wc -l
  7

▶ time find images -iname '*.jpg' | xargs -I {} guetzli --quality 85 {} compressed/{}
find images -iname '*.jpg'  0.00s user 0.00s system 40% cpu 0.009 total
xargs -I {} guetzli --quality 85 {} compressed/{}  35.74s user 0.68s system 99% cpu 36.560 total
And now the same but with machma:
▶ time find images -iname '*.jpg' | machma -- guetzli --quality 85 {} compressed/{}

processed 7 items (0 failures) in 0:10
find images -iname '*.jpg'  0.00s user 0.00s system 51% cpu 0.005 total
machma -- guetzli --quality 85 {} compressed/{}  58.47s user 0.91s system 546% cpu 10.857 total
Basically, it took only 11 seconds. This time there were fewer images (7) than there was CPUs (8), so basically the poor computer is doing super intensive CPU (and memory) work across all CPUs at the same time. The average time for each of these files is ~5 seconds so it's really interesting that even if you try to do this in parallel execution instead of taking a total of ~5 seconds, it took almost double that.
In conclusion
Such a handy tool to have around for command line stuff. I haven't looked at its code much but it's almost a shame that the project only has 300+ GitHub stars. Perhaps because it's kinda complete and doesn't need much more work.
Also, if you attempt all the examples above you'll notice that when you use the ... | xargs ... approach the stdout and stderr is a mess. For wget, that's why I used -q to silence it a bit. With machma you get a really pleasant color coded live output that tells you the state of the queue, possible failures and an ETA.
Experimenting with Guetzli
May 24, 2017
0 comments Linux, Web development, MacOSX
tl;dr; Guetzli, the new JPEG compression program from Google can save a bytes with little loss of quality.
Inspired by this blog post about Guetzli I thought I'd try it out with something that's relevant to my project, 300x300 JPGs that can be heavily compressed.
So I installed it (with Homebrew) on my MacBook Pro (late 2013) and picked 7 JPGs I had, and use in SongSearch. Which is interesting because these JPEGs have already been compressed once. They are taken from converting from much larger PNGs with PIL (Pillow) at quality rating 80%. In other words, this is Guetzli on top of PIL.
I ran one iteration for every image for the following qualities: 85%, 90%, 95%, 99%, 100%.
The results on the size are as follows:
| Image | Average Size (bytes) | % Smaller |
|---|---|---|
| original | 23497.0 | 0 |
| 85% | 16025.4 | 32% |
| 90% | 18829.4 | 20% |
| 95% | 21338.1 | 9.2% |
| 99% | 22705.3 | 3.4% |
| 100% | 22919.7 | 2.5% |
So, for example, if you choose the 90% quality you save, on average, 4,667B (4.6KB).
As you might already know, Guetzli is incredibly memory hungry and very very slow. On average each image compression took on average 4-6 seconds (higher quality, shorter times). Meaning, if you like Guetzli you probably need to build around it so that the compression happens in a build step or async somewhere and ideally you don't want to run too many compressions in parallel as it might cause CPU and memory overloading.
Now, how does it look?
Go to https://codepen.io/peterbe/pen/rmPMpm and stare at the screen to see if you can A) see which one is more compressed and B) if the one that is more compressed is too low quality.
What do you think?
Is it worth it?
Is the quality drop too much to save 10% on image sizes?
Please share your thoughts. Perhaps we can re-do this experiment with some slightly larger JPGs.
Time to do concurrent CPU bound work
May 13, 2016
3 comments Python, Linux, MacOSX
Did you see my blog post about Decorated Concurrency - Python multiprocessing made really really easy? If not, fear not. There, I'm demonstrating how I take a task of creating 100 thumbnails from a large JPG. First in serial, then concurrently, with a library called deco. The total time to get through the work massively reduces when you do it concurrently. No surprise. But what's interesting is that each individual task takes a lot longer. Instead of 0.29 seconds per image it took 0.65 seconds per image (...inside each dedicated processor).
The simple explanation, even from a layman like myself, must be that when doing so much more, concurrently, the whole operating system struggles to keep up with other little subtle tasks.
With deco you can either let Python's multiprocessing just use as many CPUs as your computer has (8 in the case of my Macbook Pro) or you can manually set it. E.g. @concurrent(processes=5) would spread the work across a max of 5 CPUs.
So, I ran my little experiment again for every number from 1 to 8 and plotted the results:
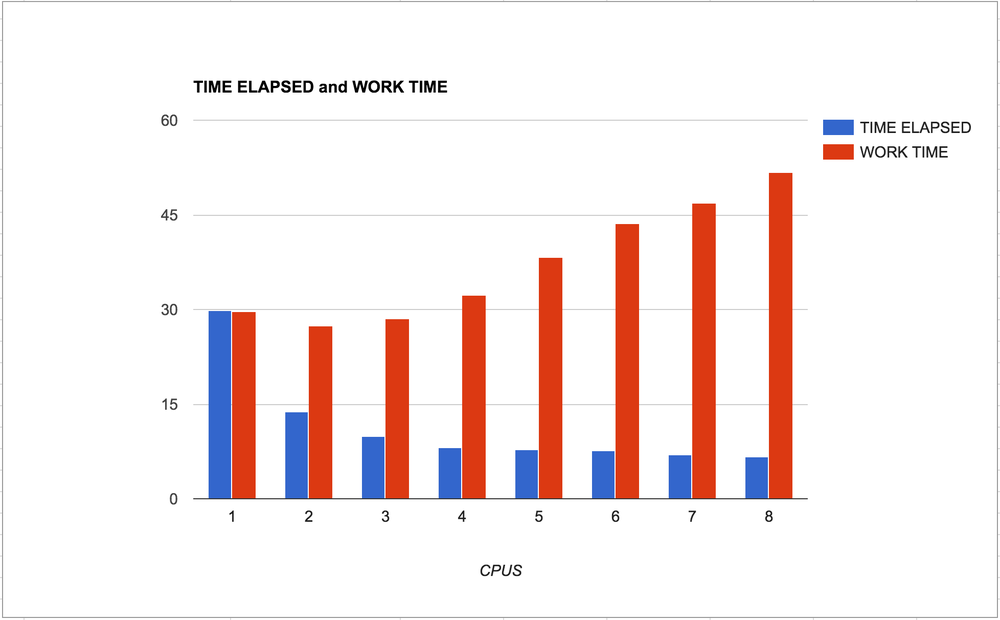
What to take away...
The blue bars is the time it takes, in total, from starting the program till the program ends. The lower the better.
The red bars is the time it takes, in total, to complete each individual task.
Meaning, when the number of CPUs is low you have to wait longer for all the work to finish and when the number of CPUs is high the computer needs more time to finish its work. This is an insight into over-use of operating system resources.
If the work is much much more demanding than this experiment (the JPG is only 3.3Mb and one thumbnail only takes 0.3 seconds to make) you might have a red bar on the far right that is too expensive for your server. Or worse, it might break things so that everything stops.
In conclusion...
Choose wisely. Be aware how "bound" the task is.
Also, remember that if the work of each individual task is too "light", the overhead of messing with multprocessing might actually cost more than it's worth.
The code
Here's the messy code I used:
import time
from PIL import Image
from deco import concurrent, synchronized
import sys

processes = int(sys.argv[1])
assert processes >= 1
assert processes <= 8


@concurrent(processes=processes)
def slow(times, offset):
    t0 = time.time()
    path = '9745e8.jpg'
    img = Image.open(path)
    size = (100 + offset * 20, 100 + offset * 20)
    img.thumbnail(size, Image.ANTIALIAS)
    img.save('thumbnails/{}.jpg'.format(offset), 'JPEG')
    t1 = time.time()
    times[offset] = t1 - t0


@synchronized
def run(times):
    for index in range(100):
        slow(times, index)

t0 = time.time()
times = {}
run(times)
t1 = time.time()
print "TOOK", t1-t0
print "WOULD HAVE TAKEN", sum(times.values())
UPDATE
I just wanted to verify that the experiment is valid that proves that CPU bound work hogs resources acorss CPUs that affects their individual performance.
Let's try to the similar but totally different workload of a Network bound task. This time, instead of resizing JPEGs, it waits for finishing HTTP GET requests.
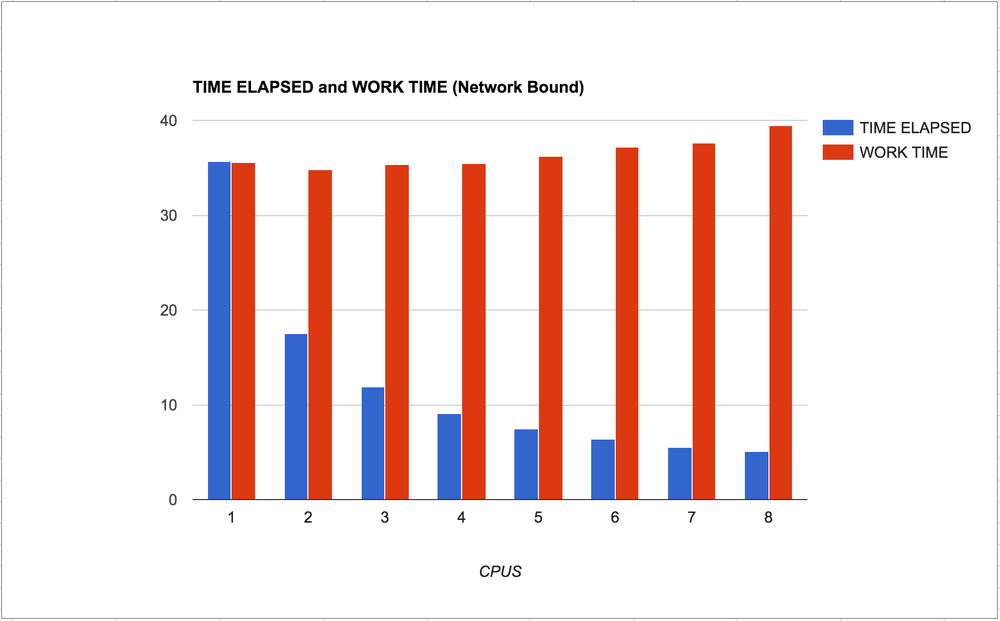
So clearly it makes sense. The individual work withing each process is not generally slowed down much. A tiny bit, but not much. Also, I like the smoothness of the curve of the blue bars going from left to right. You can clearly see that it's reverse logarithmic.
.git/info/exclude, .gitignore and ~/.gitignore_global
April 20, 2016
4 comments Linux, MacOSX
How did I not know about this until now?! .git/info/exlude is like .gitingore but yours to mess with. Thanks @willkg!
There are three ways to tell Git to ignore files.
.gitignore
A file you check in to the project. It's shared amongst developers on the project. It's just a plain text file where you write one line per file pattern that Git should not ask "Have you forgotten to check this in?"
Certain things that are good to put in there are...:
node_modules/
*.py[co]
.coverage
Ideally, this file should be as small as possible and every entry should confidently be something 100% of the developers on the team will want to ignore. If your particular editor has some convention for storing state or revision files, that does not belong on this file.
A reason to keep it short is that of purity and simplicity. Every edit of this file will require a git commit.
~/.gitignore_global
This is yours to keep and maintain. The file doesn't have to be in your home directory. (The ~/ is UNIX nomenclature for your OS user home directory). You can set it to be anything. Like:
$ git config --global core.excludesfile ~/projects/dotfiles/gitignore-global.txt
Here you put stuff you want to personally ignore in every Git project. New and old.
Good examples of things to put in it are...:
*~
.DS_Store
.env
settings/local.py
pip-log.txt
.git/info/exclude
This is a kinda mix between the two above mentioned ignore files. This is things only you want to ignore in a specific project. More or less "junk files" specific to a project. For example if you, in your Git clone, has some test scripts or a specific log file.
Suppose you have a little hack script or some specific config that is only applicable to the project at hand, this is where you add it. For example...:
run_webapp_uwsgi.sh
analyze_correlation_json_dumps.py
I hope this helps someone else who, like me, didn't know about .git/info/exclude until 2016.
Ctags in Atom on OSX
February 26, 2016
0 comments Web development, MacOSX
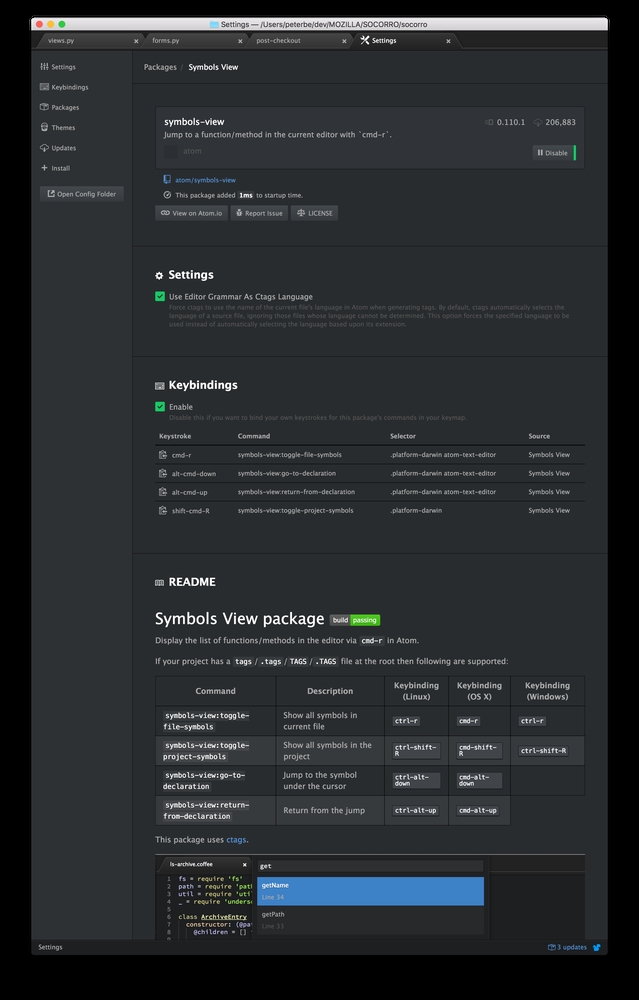
In Atom, by default there's a package called symbols-view. It basically allows you to search for particular functions, classes, variables etc. Most often not by typing but by search based on whatever word the cursor is currently on.
With this all installed and set up I can now press Cmd-alt-Down and it automatically jumps to the definition of that thing. If the result is ambiguous (e.g. two functions called get_user_profile) it'll throw up the usual search dialog at the top.
To have this set up you need to use something called ctags. It's a command line tool.
This Stack Overflow post helped tremendously. The ctags I had installed was something else (presumably put there by installing emacs). So I did:
$ brew install ctags
And then added
alias ctags="`brew --prefix`/bin/ctags"
...in my ~/.bash_profile
Now I can run ctags -R . and it generates a binary'ish file called tags in the project root.
However, the index of symbols in a project greatly varies with different branches. So I need a different tags file for each branch. How to do that? By hihjacking the .git/hooks/post-checkout hook.
Now, this is where things get interesting. Every project has "junk". Stuff you have in your project that isn't files you're likely to edit. So you'll need to list those one by one. Anyway, here's what my post-checkout looks like:
#!/bin/bash

set -x

ctags -R \
  --exclude=build \
  --exclude=.git \
  --exclude=webapp-django/static \
  --exclude=webapp-django/node_modules \
  .
This'll be run every time I check out a branch, e.g. git checkout master.
Best Atom packages of 2015
January 22, 2016
7 comments Web development, MacOSX
tl;dr last-cursor-position, advanced-open-file and highlight-line
Sorry, for the sensationalist headline on this blog post. Almost all of Atom, including the core functionality, is based on packages. For example, the autocomplete thing that pops up whilst you're typing is a package with its own git repo and README. However, it's not a community package. Let's focus on those instead.
Number 1
If you're in the midst of typing and for some reason you need to scroll somewhere else in the code to type something or to select to copy to the clipboard, how do you get back? You can either memorize which line you were on. Or you can split the windows so that when you're done, elsewhere, you just kill the newly created split-window. Or; you install last-cursor-position.
At any time you can press alt-- (that's alt and the minus character) and it'll go back to where the cursor was last.
It works across open tabs too. So if you switch tabs to edit index.html and want to go back to that app.py you were working on you can alt-- yourself back there. And suppose that you want to go back to index.html again, you hit shift-alt--.
Number 2
This was written by a friend of mine called Michael "Osmose" Kelly and this was his first package he wrote. It's apparently very popular and Michael's most popular Open Source project to date.
What it does is introduce a command-line looking prompt for opening files. By default, you start it with Ctrl-x Ctrl-f which is the Emacs command for opening files/buffers.
Don't get me wrong, I love using Cmd-t to fuzzy-find files and that's awesome too, but sometimes when you have eleventeen files called models.py and you want the one in the "current directory" it's much easier to just go directly to that file. I type Cmd-x Cmd-f m [TAB] [ENTER] and I'm there. Had I typed m on the fuzzy-finder it would certainly have yielded too many files.
Another really really useful thing about this package is that I can easily go to any other file outside the current directory. Suppose my Atom window is rooted in ~/dev/PYTHON/premailer/ and I want to open /tmp/hack.js I easily can, thanks to this package without reaching for the mouse.
Number 3
The name well describes what it does. But why do I need it? The answer is simple; it's when I jump around. When I'm in the midst of typing a function or snippet or something I don't need to know which line I'm on because things are settled. No, it's when I go somewhere else, for example using the last-cursor-position package, then it's hard to see where the cursor is. Especially relevant when you have a big screen with high resolution.
Why isn't this a core package?!
In Summary
I bet I've forgotten some package that I love and use every day that isn't a core package. If so, it's probably something subtle or something that I almost take for granted. For example, who doesn't use react or atom-beautify?! Also, those packages are already so popular they don't need a blog post to raise their attention and fame :)
What was your favorites that you like so much that they just need to be highlighted? Leave a comment or discuss here.