(Thanks Miles Crabil not only for being an awesome Ops person but also for reviewing this blog post!)
My project over the summer, here at Mozilla, has been a project called Mozilla Symbol Server. It's a web service that uploads C++ symbol files, downloads C++ symbol files and symbolicates C++ crash stacktraces. It went into production last week which was fun but there's still lots of work to do on adding beyond-parity features and more optimizations.
What Is Mozilla Symbol Server?
The code name for this project is Tecken and it's written in Python (Django, Gunicorn) and uses PostgreSQL, Redis and Celery. The frontend is entirely static and developed (almost) as a separate project within. The frontend is written in React (using create-react-app and react-router). Everything is run as Docker containers. And if you ask me more details about how it's configured/deployed I'm afraid I have to defer to the awesome Mozilla CloudOps team.
One the challenges I faces developing Tecken is that symbol downloads need to be fast to handle high volumes of traffic. Today I did some load testing on our stage deployment and managed to start 14 concurrent clients that bombarded our staging server with realistic HTTPS GET queries based on log files. It's actually 7 + 1 + 4 + 2 concurrent clients. 7 of them from a m3.2xlarge EC2 node (8 vCPUs), 1 from a m3.large EC2 node (1 vCPU), 2 from two separate NYC based DigitalOcean personal servers and 2 clients here from my laptop on my home broadband. Basically, each loadtest script process got its own CPU.
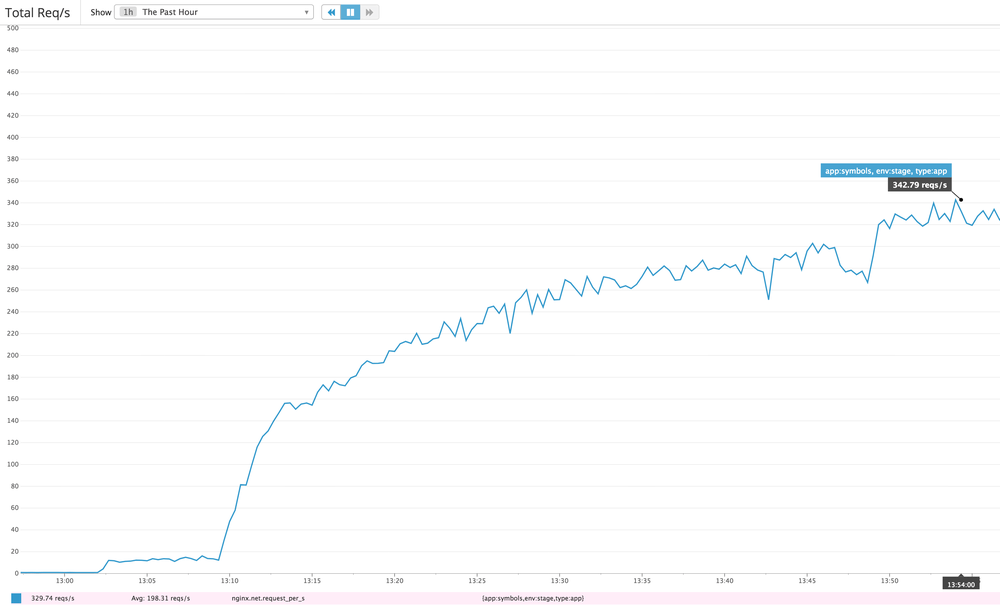
It's hard to know how much more each client could push if it wasn't slowed down. Either way, the server managed to sustain about 330 requests per second. Our production baseline goal is to able to handle at least 40 requests per second.
After running for a while the caches started getting warm but about 1-5% of requests do have to make a boto3 roundtrip to an S3 bucket located on the other side of America in Oregon. There is also a ~5% penalty in that some requests trigger a write to a central Redis ElastiCache server. That's cheaper than the boto3 S3 call but still hefty latency costs to pay.
The ELB in our staging environment spreads the load between 2 c4.large (2 vCPUs, 3.75GB RAM) EC2 web heads. Each running with preloaded Gunicorn workers between Nginx and Django. Each web head has its own local memcached server to share memory between each worker but only local to the web head.
Is this a lot?
How long is a rope? Hard to tell. Tecken's performance is certainly more than enough and by the sheer fact that it was only just production deployed last week tells me we can probably find a lot of low-hanging fruit optimizations on the deployment side over time.
One way of answering that is to compare it with our lightest endpoint. One that involves absolutely no external resources. It's just pure Python in the form of ELB → Nginx → Gunicorn → Django. If I run hey from the same server I did the load testing I get a topline of 1,300 requests per second.
$ hey -n 10000 -c 10 https://symbols.stage.mozaws.net/__lbheartbeat__
Summary:
  Total:    7.6604 secs
  Slowest:  0.0610 secs
  Fastest:  0.0018 secs
  Average:  0.0075 secs
  Requests/sec: 1305.4199
...
That basically means that all the extra "stuff" (memcache key prep, memcache key queries and possible other high latency network requests) it needs to do in the Django view takes up roughly 3x the time it takes the absolute minimal Django request-response rendering.
Also, if I use the same technique to bombard a single URL, but one that actually involves most code steps but is definitely able to not require any slow ElastiCache writes or boto3 S3 reads you I get 800 requests per second:
$ hey -n 10000 -c 10 https://symbols.stage.mozaws.net/advapi32.pdb/5EFB9BF42CC64024AB64802E467394642/advapi32.sy
Summary:
  Total:    12.4160 secs
  Slowest:  0.0651 secs
  Fastest:  0.0024 secs
  Average:  0.0122 secs
  Requests/sec: 805.4150
  Total data:   300000 bytes
  Size/request: 30 bytes
...
Lesson learned
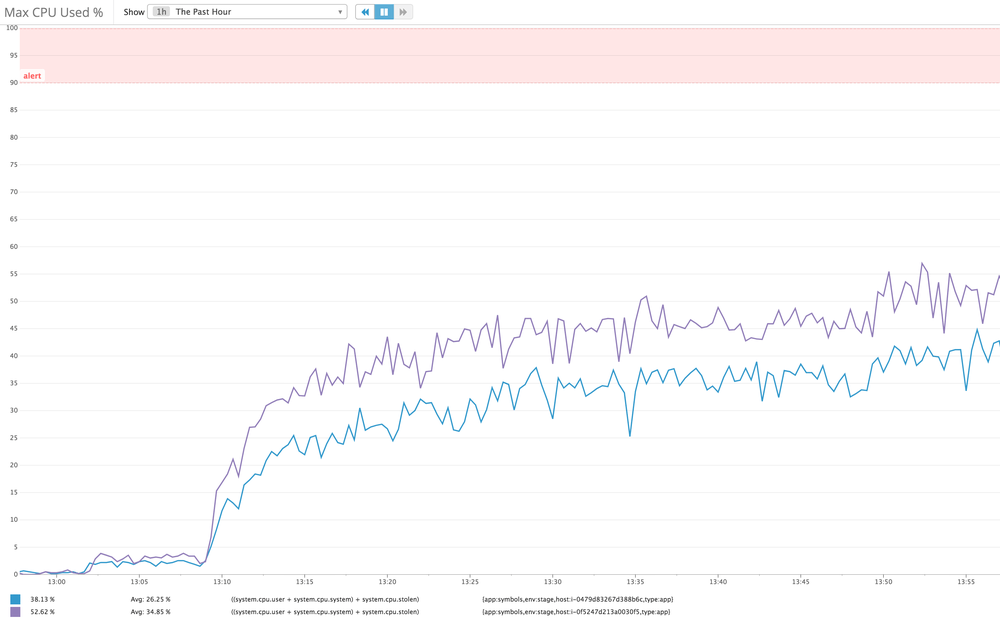
It's a recurring reminder that performance is almost all about latency. If not RAM or disk it's networking. See the graph of the "Max CPU Used" which basically shows that CPU of user, system and stolen ("CPU spent waiting for the hypervisor to service another virtual CPU") never sum totalling over 50%.