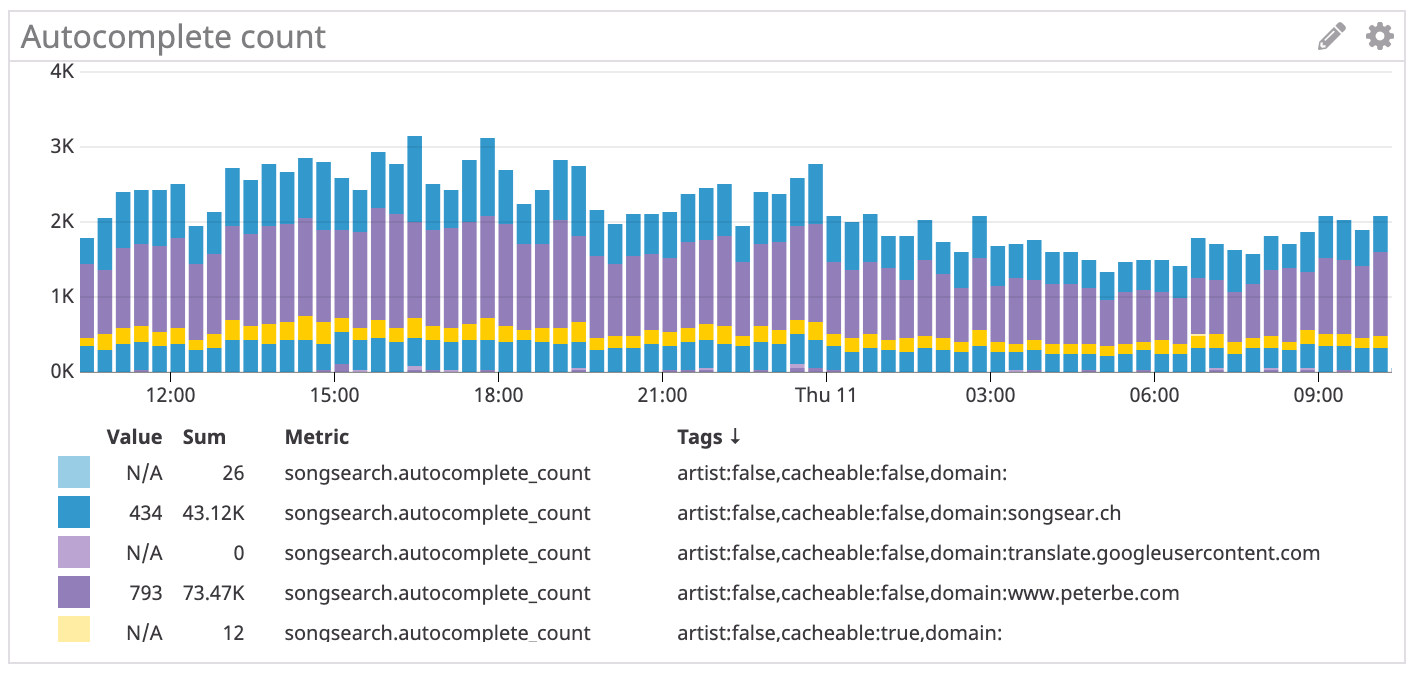
By analyzing my Nginx logs, I've concluded that SongSearch's autocomplete JSON API now gets about 2.2 requests per second. I.e. these are XHR requests to /api/search/autocomplete?q=....
Roughly, 1.8 requests per second goes back to the Django/Elasticsearch backend. That's a hit ratio of 16%. These Django/Elasticsearch requests take roughly 200ms on average. I suspect about 150-180ms of that time is spent querying Elasticsearch, the rest being Python request/response and JSON "paperwork".
Caching strategy
Caching is hard because the queries are so vastly different over time. Had I put a Redis cache decorator on the autocomplete Django view function I'd quickly bloat Redis memory and cause lots of evictions.
What I used to do was something like this:
def search_autocomplete(request):
   q = request.GET.get('q')

   cache_key = None
   if len(q) < 10:
      cache_key = 'autocomplete:' + q
      results = cache.get(cache_key)
      if results is not None:
          return http.JsonResponse(results)

   results = _do_elastisearch_query(q)
   if cache_key:
       cache.set(cache_key, results, 60 * 60)

   return http.JsonResponse(results)
However, after some simple benchmarking it was clear that using Nginx' uwsgi_cache it was much faster to let the cacheable queries terminate already at Nginx. So I changed the code to something like this:
def search_autocomplete(request):
   q = request.GET.get('q')
   results = _do_elastisearch_query(q)
   response = http.JsonResponse(results)

   if len(q) < 10:
       patch_cache_control(response, public=True, max_age=60 * 60)

   return response
The only annoying thing about Nginx caching is that purging is hard unless you go for that Nginx Plus (or whatever their enterprise version is called). But more annoying, to me, is that fact that I can't really see what this means for my server. When I was caching with Redis I could just use redis-cli and...
> INFO
...
# Memory
used_memory:123904288
used_memory_human:118.16M
...
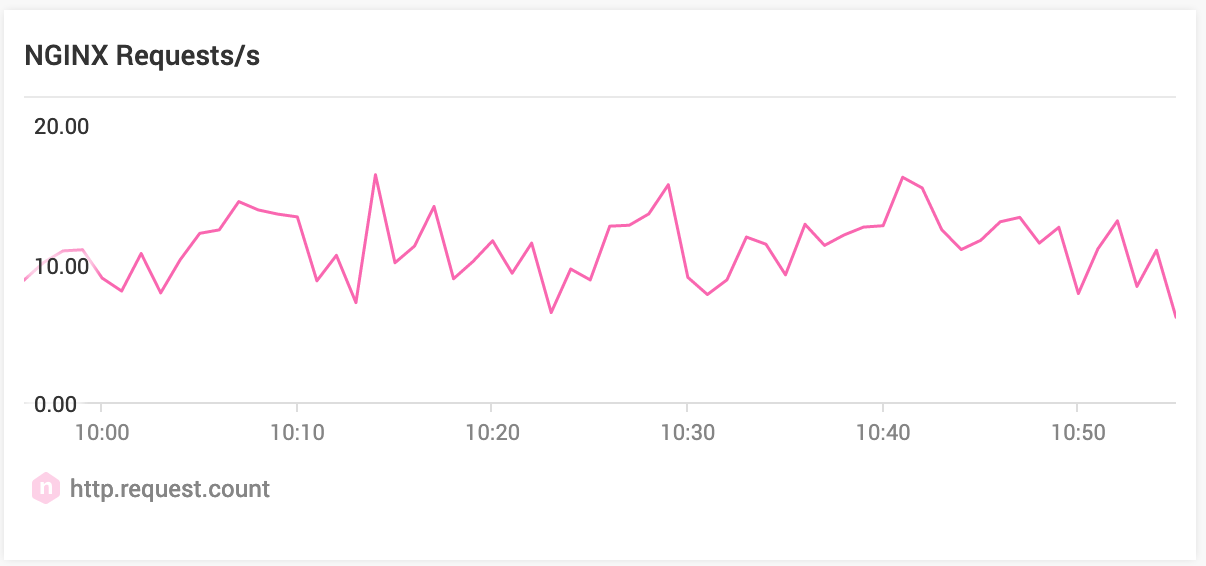
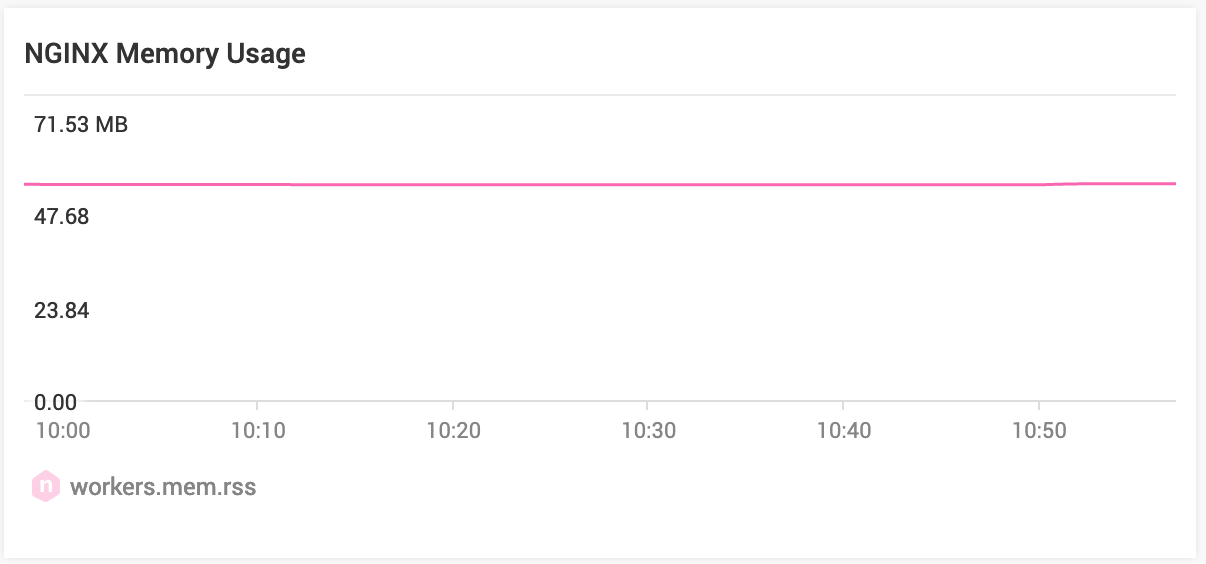
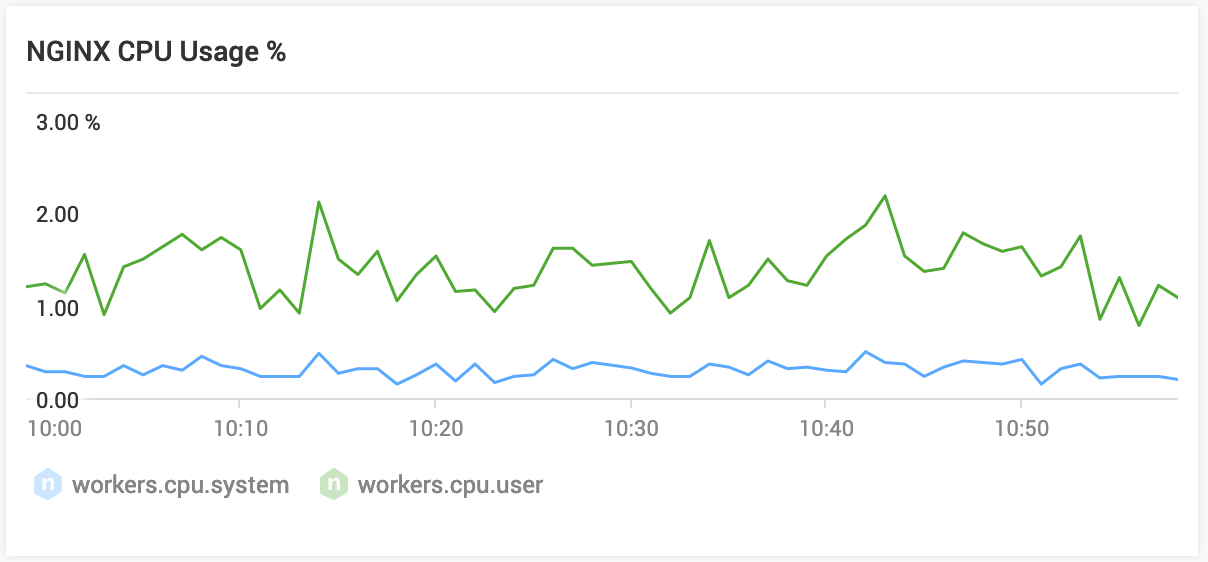
Nginx Amplify
My current best tool for keeping an eye on Nginx is Nginx Amplify. It gives me some basic insights about the state of things. Here are some recent screenshots:
Thoughts and conclusion
Caching is hard. But it's also fun because it ties directly into performance work.
In my business logic, I chose that autocomplete queries that are between 1 and 9 characters are cacheable. And I picked a TTL of 60 minutes. At this point, I'm not sure exactly why I chose that logic but I remember doing some back-of-envelope calculations about what the hit ratio would be and roughly what that would mean in bytes in RAM. I definitely remember picking 60 minutes because I was nervous about bloating Nginx's memory usage. But as of today, I'm switching that up to 24 hours and let's see what that does to my current 16% Nginx cache hit ratio. At the moment, /var/cache/nginx-cache/ is only 34MB which isn't much.
Another crux with using uwsgi_cache (or proxy_cache) is that you can't control the cache key very well. When it was all in Python I was able to decide about the cache key myself. A plausible implementation is cache_key = q.lower().strip() for example. That means you can protect your Elasticsearch backend from having to do {"q": "A"} and {"q": "a"}. Who knows, perhaps there is a way to hack this in Nginx without compiling in some Lua engine.
The ideal would be some user-friendly diagnostics tool that I can point somewhere, towards Nginx, that says how much my uwsgi_cache is hurting or saving me. Autocomplete is just one of many things going on on this single DigitalOcean server. There's also a big PostgreSQL server, a node-express cluster, a bunch of uwsgi workers, Redis, lots of cron job scripts, and of course a big honking Elasticsearch 6.
UPDATE (July 12 2019)
Currently, and as mentioned above, I only set Cache-Control headers (which means Nginx snaps it up) for queries that at max 9 characters long. I wanted to appreciate and understand how ratio of all queries are longer than 9 characters so I wrote a report and its output is this:
POINT: 7
Sum show 75646 32.2%
Sum rest 159321 67.8%

POINT: 8
Sum show 83702 35.6%
Sum rest 151265 64.4%

POINT: 9
Sum show 90870 38.7%
Sum rest 144097 61.3%

POINT: 10
Sum show 98384 41.9%
Sum rest 136583 58.1%

POINT: 11
Sum show 106093 45.2%
Sum rest 128874 54.8%

POINT: 12
Sum show 113905 48.5%
Sum rest 121062 51.5%
It means that (independent of time expiry) 38.7% of queries are 9 characters or less.
Comments