10 years a Mozillian, always a Mozillian
August 30, 2021
2 comments Web development, Mozilla, MDN
As of September 2021, I am leaving Mozilla after 10 years. It hasn't been perfect but it's been a wonderful time with fond memories and an amazing career rocket ship.
In April 2011, I joined as a web developer to work on internal web applications that support the Firefox development engineering. In rough order, I worked on...
- Elmo: The web application for managing the state of Firefox localization
- Socorro: When Firefox crashes and asks to send a crash dump, this is the storage plus website for analyzing that
- Peekaboo: When people come to visit a Mozilla office, they sign in on a tablet at the reception desk
- Balrog: For managing what versions are available for Firefox products to query when it's time to self-upgrade
- Air Mozilla: For watching live streams and video archive of all recordings within the company
- MozTrap: When QA engineers need to track what, and the results, of QA testing Firefox products
- Symbol Server: Where all C++ debug symbols are stored from the build pipeline to be used to source-map crash stack traces
- Buildhub: To get a complete database of all and every individual build shipped of Firefox products
- Remote Settings: Managing experiments and for Firefox to "phone home" for smaller updates/experiments between releases
- MDN Web Docs: Where web developers go to look up all the latest and most detailed details about web APIs
This is an incomplete list because at Mozilla you get to help each other and I shipped a lot of smaller projects too, such as Contribute.json, Whatsdeployed, GitHub PR Triage, Bugzilla GitHub Bug Linker.
Reflecting back, the highlight of any project is when you get to meet or interact with the people you help. Few things are as rewarding as when someone you don't know, in person, finds out what you do and they say: "Are you Peter?! The one who built XYZ? I love that stuff! We use it all the time now in my team. Thank you!" It's not a brag because oftentimes what you build for fellow humans it isn't engineering'ly brilliant in any way. It's just something that someone needed. Perhaps the lesson learned is the importance of not celebrating what you've built but just put you into the same room as who uses what you built. And, in fact, if what you've built for someone else isn't particularly loved, by meeting and fully interactive with the people who use "your stuff" gives you the best of feedback and who doesn't love constructive criticism so you can become empowered to build better stuff.
Mozilla is a great company. There is no doubt in my mind. We ship high-quality products and we do it with pride. There have definitely been some rough patches over the years but that happens and you just have to carry on and try to focus on delivering value. Firefox Nightly will continue to be my default browser and I'll happily click any Google search ads to help every now and then. THANK YOU everyone I've ever worked with at Mozilla! You are a wonderful bunch of people!
Whatsdeployed facelift
January 5, 2018
0 comments Python, Web development, Mozilla, Docker
tl;dr; Whatsdeployed.io is an impressively simple web app to help web developers and web ops people quickly see what GitHub commits have made it into your Dev, Stage or Prod environment. Today it got a facelift.
The code is now more than 5 years old and has served me well. It's weird to talk too positively about the app because I actually wrote it but because it's so simple in terms of design and effort it feels less personal to talk about it.
Here's what's in the facelift
- Upgraded to Bootstrap 4.
- Instead of relying on downloading a heavy Glyphicon web font, just to display a single checkmark, that's now a simple image.
- Ability to use a GitHub developer personal token to avoid rate limitations on GitHub's API.
- The first lookup to get all commits is now done via the Flask app to use my auth token to avoid the rate limit.
- Much better error handling if any of the underlying
requests.get()that the Flask app does, fails. Also includes which URL it failed on. - Basic validation to prevent submitting the main form without typing anything in.
- You can hack on it with Docker. Thanks @willkg.
- Improved the code that extracts Bugzilla bug numbers out of commit messages. Thanks @edmorely.
- Refreshed screenshots in the
README.md - A brand new introduction text on the home page for people who end up on the site not knowing what it is.
- If any XHR errors happen figuring out the "culprits", you now get a pretty error describing this instead of swallowing it all.
Please let me know if there's anything broken or missing.
Another win for Tracking Protection in Firefox
December 13, 2017
0 comments Web development, Mozilla
When I read Swedish news I usually open DN.se. At least I used to. Opening it used to feel like an "investment". It takes too long to load and it makes the browser all janky because of the weight of all ad videos and whatnot.
With Tracking Protection, which is built in to recent versions of Firefox, all of those load speed concerns goes away pretty much.
Without Tracking Protection

- 322 requests
- 8.78MB transferred
- 16.12s to finish fully loading
With Tracking Protection

- 67 requests
- 1.15MB transferred
- 8.42s to finish fully loading
I've blogged about this before but I'm just so excited I felt like repeating it. With Tracking Protection now enabled it actually feels fun to open heavy-on-ads news sites again. Perhaps even worth paying for.
Unzip benchmark on AWS EC2 c3.large vs c4.large
November 29, 2017
18 comments Python, Linux, Mozilla, Go
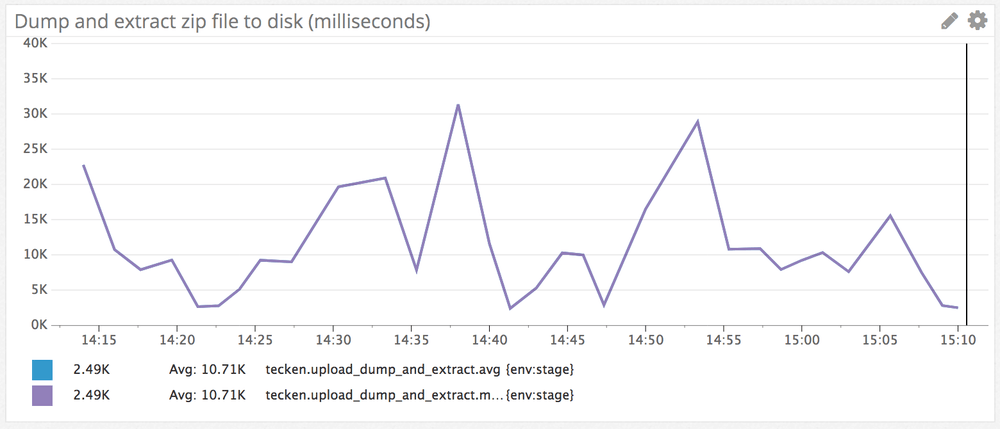
This web app I'm working on gets a blob of bytes from a HTTP POST. The nature of the blob is a 100MB to 1,100MB blob of a zip file. What my app currently does is that it takes this byte buffer, uses Python's built in zipfile to extract all its content to a temporary directory. A second function then loops over the files within this extracted tree and processes each file in multiple threads with concurrent.futures.ThreadPoolExecutor. Here's the core function itself:
@metrics.timer_decorator('upload_dump_and_extract')
def dump_and_extract(root_dir, file_buffer):
    zf = zipfile.ZipFile(file_buffer)
    zf.extractall(root_dir)
So far so good.
Speed Speed Speed
I quickly noticed that this is amounting to quite a lot of time spent doing the unzip and the writing to disk. What to do????
At first I thought I'd shell out to good old unzip. E.g. unzip -d /tmp/tempdirextract /tmp/input.zip but that has two flaws:
1) I'd first have to dump the blob of bytes to disk and do the overhead of shelling out (i.e. Python subprocess)
2) It's actually not faster. Did some experimenting and got the same results at Alex Martelli in this Stackoverflow post
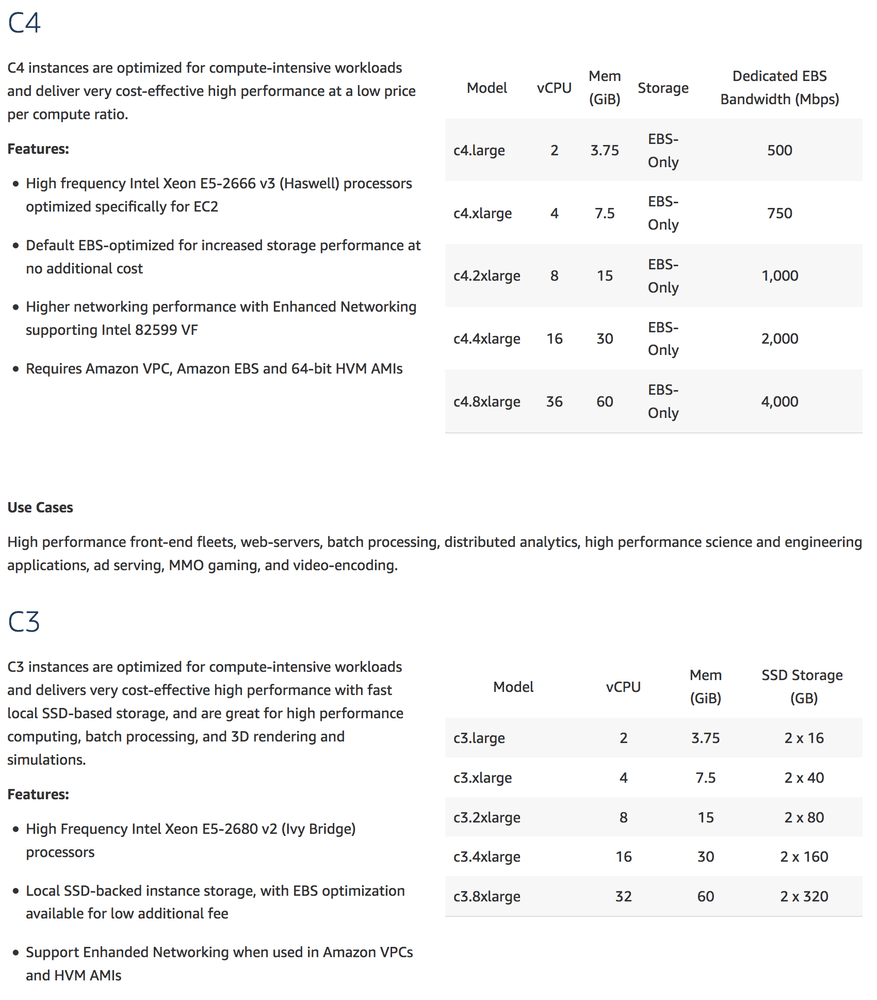
What about disk speed? Yeah, this is likely to be a part of the total time. The servers that run the symbols.mozilla.org service runs on AWS EC2 c4.large. This only has EBS (Elastic Block Storage). However, AWS EC2 c3.large looks interesting since it's using SSD disks. That's probably a lot faster. Right?
Note! For context, the kind of .zip files I'm dealing with contain many small files and often 1-2 really large ones.
EC2s Benchmarking
I create two EC2 nodes to experiment on. One c3.large and one c4.large. Both running Ubuntu 16.04.
Next, I have this little benchmarking script which loops over a directory full of .zip files between 200MB-600MB large. Roughly 10 of them. It then loads each one, one at a time, into memory and calls the dump_and_extract. Let's run it on each EC2 instance:
On c4.large
c4.large$ python3 fastest-dumper.py /tmp/massive-symbol-zips
138.2MB/s            291.1MB              2.107s
146.8MB/s            314.5MB              2.142s
144.8MB/s            288.2MB              1.990s
84.5MB/s             532.4MB              6.302s
146.6MB/s            314.2MB              2.144s
136.5MB/s            270.7MB              1.984s
85.9MB/s             518.9MB              6.041s
145.2MB/s            306.8MB              2.113s
127.8MB/s            138.7MB              1.085s
107.3MB/s            454.8MB              4.239s
141.6MB/s            251.2MB              1.774s


Average speed: 127.7MB/s
Median speed:  138.2MB/s

Average files created:       165
Average directories created: 129
On c3.large
c3.large$ python3 fastest-dumper.py -t /mnt/extracthere /tmp/massive-symbol-zips
105.4MB/s            290.9MB              2.761s
98.1MB/s             518.5MB              5.287s
108.1MB/s            251.2MB              2.324s
112.5MB/s            294.3MB              2.615s
113.7MB/s            314.5MB              2.767s
106.3MB/s            291.5MB              2.742s
104.8MB/s            291.1MB              2.778s
114.6MB/s            248.3MB              2.166s
114.2MB/s            248.2MB              2.173s
105.6MB/s            298.1MB              2.823s
106.2MB/s            297.6MB              2.801s
98.6MB/s             521.4MB              5.289s


Average speed: 107.3MB/s
Median speed:  106.3MB/s

Average files created:       165
Average directories created: 127
What the heck!? The SSD based instance is 23% slower!
I ran it a bunch of times and the average and median numbers are steady. c4.large is faster than c3.large at unzipping large blobs to disk. So much for that SSD!
Something Weird Is Going On
It's highly likely that the unzipping work is CPU bound and that most of those, for example, 5 seconds is spent unzipping and only a small margin is the time it takes to write to disk.
If the unzipping CPU work is the dominant "time consumer" why is there a difference at all?!
Or, is the "compute power" the difference between c3 and c4 and disk writes immaterial?
For the record, this test clearly demonstrates that the locally mounted SSD drive is 600% faster than ESB.
c3.large$ dd if=/dev/zero of=/tmp/1gbtest bs=16k count=65536
65536+0 records in
65536+0 records out
1073741824 bytes (1.1 GB, 1.0 GiB) copied, 16.093 s, 66.7 MB/s
c3.large$ sudo dd if=/dev/zero of=/mnt/1gbtest bs=16k count=65536
65536+0 records in
65536+0 records out
1073741824 bytes (1.1 GB, 1.0 GiB) copied, 2.62728 s, 409 MB/s
Let's try again. But instead of using c4.large and c3.large, let's use the beefier c4.4xlarge and c3.4xlarge. Both have 16 vCPUs.
c4.4xlarge
c4.4xlarge$ python3 fastest-dumper.py /tmp/massive-symbol-zips
130.6MB/s            553.6MB              4.238s
149.2MB/s            297.0MB              1.991s
129.1MB/s            529.8MB              4.103s
116.8MB/s            407.1MB              3.486s
147.3MB/s            306.1MB              2.077s
151.9MB/s            248.2MB              1.634s
140.8MB/s            292.3MB              2.076s
146.8MB/s            288.0MB              1.961s
142.2MB/s            321.0MB              2.257s


Average speed: 139.4MB/s
Median speed:  142.2MB/s

Average files created:       148
Average directories created: 117
c3.4xlarge
c3.4xlarge$ python3 fastest-dumper.py -t /mnt/extracthere /tmp/massive-symbol-zips
95.1MB/s             502.4MB              5.285s
104.1MB/s            303.5MB              2.916s
115.5MB/s            313.9MB              2.718s
105.5MB/s            517.4MB              4.904s
114.1MB/s            288.1MB              2.526s
103.3MB/s            555.9MB              5.383s
114.0MB/s            288.0MB              2.526s
109.2MB/s            251.2MB              2.300s
108.0MB/s            291.0MB              2.693s


Average speed: 107.6MB/s
Median speed:  108.0MB/s

Average files created:       150
Average directories created: 119
What's going on!? The time it takes to unzip and write to disk is, on average, the same for c3.large as c3.4xlarge!
Is Go Any Faster?
I need a break. As mentioned above, the unzip command line program is not any better than doing it in Python. But Go is faster right? Right?
Please first accept that I'm not a Go programmer even though I can use it to build stuff but really my experience level is quite shallow.
Here's the Go version. Critical function that does the unzipping and extraction to disk here:
func DumpAndExtract(dest string, buffer []byte, name string) {
    size := int64(len(buffer))
    zipReader, err := zip.NewReader(bytes.NewReader(buffer), size)
    if err != nil {
        log.Fatal(err)
    }
    for _, f := range zipReader.File {
        rc, err := f.Open()
        if err != nil {
            log.Fatal(err)
        }
        defer rc.Close()
        fpath := filepath.Join(dest, f.Name)
        if f.FileInfo().IsDir() {
            os.MkdirAll(fpath, os.ModePerm)
        } else {
            // Make File
            var fdir string
            if lastIndex := strings.LastIndex(fpath, string(os.PathSeparator)); lastIndex > -1 {
                fdir = fpath[:lastIndex]
            }
            err = os.MkdirAll(fdir, os.ModePerm)
            if err != nil {
                log.Fatal(err)
            }
            f, err := os.OpenFile(
                fpath, os.O_WRONLY|os.O_CREATE|os.O_TRUNC, f.Mode())
            if err != nil {
                log.Fatal(err)
            }
            defer f.Close()

            _, err = io.Copy(f, rc)
            if err != nil {
                log.Fatal(err)
            }
        }
    }
}
And the measurement is done like this:
size := int64(len(content))
t0 := time.Now()
DumpAndExtract(tmpdir, content, filename)
t1 := time.Now()
speed := float64(size) / t1.Sub(t0).Seconds()
It's not as sophisticated (since it's only able to use /tmp) but let's just run it see how it compares to Python:
c4.4xlarge$ mkdir ~/GO
c4.4xlarge$ export GOPATH=~/GO
c4.4xlarge$ go get github.com/pyk/byten
c4.4xlarge$ go build unzips.go
c4.4xlarge$ ./unzips /tmp/massive-symbol-zips
56MB/s         407MB          7.27804954
74MB/s         321MB          4.311504933
75MB/s         288MB          3.856798853
75MB/s         292MB          3.90972474
81MB/s         248MB          3.052652168
58MB/s         530MB          9.065985117
59MB/s         554MB          9.35237202
75MB/s         297MB          3.943132388
74MB/s         306MB          4.147176578

Average speed:    70MB/s
Median speed:     81MB/s
So... Go is, on average, 40% slower than Python in this scenario. Did not expect that.
In Conclusion
No conclusion. Only confusion.
I thought this would be a lot clearer and more obvious. Yeah, I know it's crazy to measure two things at the same time (unzip and disk write) but the whole thing started with a very realistic problem that I'm trying to solve. The ultimate question was; will the performance benefit from us moving the web servers from AWS EC2 c4.large to c3.large and I think the answer is no.
UPDATE (Nov 30, 2017)
Here's a horrible hack that causes the extraction to always go to /dev/null:
class DevNullZipFile(zipfile.ZipFile):
    def _extract_member(self, member, targetpath, pwd):
        # member.is_dir() only works in Python 3.6
        if member.filename[-1] == '/':
            return targetpath
        dest = '/dev/null'
        with self.open(member, pwd=pwd) as source, open(dest, "wb") as target:
            shutil.copyfileobj(source, target)
        return targetpath


def dump_and_extract(root_dir, file_buffer, klass):
    zf = klass(file_buffer)
    zf.extractall(root_dir)
And here's the outcome of running that:
c4.4xlarge$ python3 fastest-dumper.py --dev-null /tmp/massive-symbol-zips
170.1MB/s            297.0MB              1.746s
168.6MB/s            306.1MB              1.815s
147.1MB/s            553.6MB              3.765s
132.1MB/s            407.1MB              3.083s
145.6MB/s            529.8MB              3.639s
175.4MB/s            248.2MB              1.415s
163.3MB/s            321.0MB              1.965s
162.1MB/s            292.3MB              1.803s
168.5MB/s            288.0MB              1.709s


Average speed: 159.2MB/s
Median speed:  163.3MB/s

Average files created:       0
Average directories created: 0
I ran it a few times to make sure the numbers are stable. They are. This is on the c4.4xlarge.
So, the improvement of writing to /dev/null instead of the ESB /tmp is 15%. Kinda goes to show how much of the total time is spent reading the ZipInfo file object.
For the record, the same comparison on the c3.4xlarge was 30% improvement when using /dev/null.
Also for the record, if I replace that line shutil.copyfileobj(source, target) above with pass, the average speed goes from 159.2MB/s to 112.8GB/s but that's not a real value of any kind.
UPDATE (Nov 30, 2017)
Here's the same benchmark using c5.4xlarge instead. So, still EBS but...
"3.0 GHz Intel Xeon Platinum processors with new Intel Advanced Vector Extension 512 (AVX-512) instruction set"
Let's run it on this supposedly faster CPU:
c5.4xlarge$ python3 fastest-dumper.py /tmp/massive-symbol-zips
165.6MB/s            314.6MB              1.900s
163.3MB/s            287.7MB              1.762s
155.2MB/s            278.6MB              1.795s
140.9MB/s            513.2MB              3.643s
137.4MB/s            556.9MB              4.052s
134.6MB/s            531.0MB              3.946s
165.7MB/s            314.2MB              1.897s
158.1MB/s            301.5MB              1.907s
151.6MB/s            253.8MB              1.674s
146.9MB/s            502.7MB              3.422s
163.7MB/s            288.0MB              1.759s


Average speed: 153.0MB/s
Median speed:  155.2MB/s

Average files created:       150
Average directories created: 119
So that is, on average, 10% faster than c4.4xlarge.
Is it 10% more expensive? For a 1-year reserved instance, it's $0.796 versus $0.68 respectively. I.e. 15% more expensive. In other words, in this context it's 15% more $$$ for 10% more processing power.
UPDATE (Jan 24, 2018)
I can almost not believe it!
Thanks you Oliver who discovered (see comment below) a blaring mistake in my last conclusion. The for reserved instances (which is what we use on my Mozilla production servers) the c5.4xlarge is actually cheaper than c4.4xlarge. What?!
In my previous update I compared c4.4xlarge and c5.4xlarge and concluded that c5.4xlarge is 10% faster but 15% more expensive. That actually made sense. Fancier servers, more $$$. But it's not like that in the real world. See for yourself:
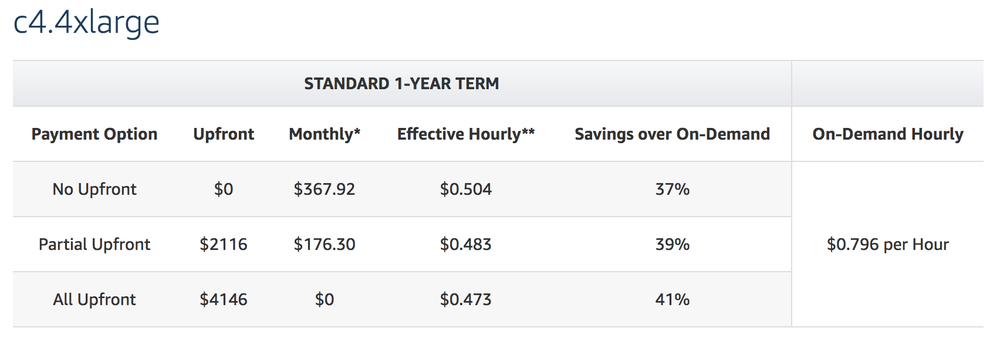
c4.4xlarge
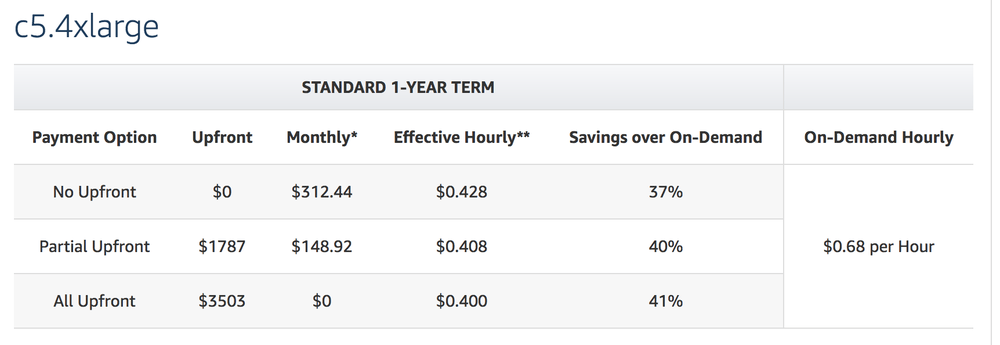
c5.4xlarge
To enable Tracking Protection for performance
November 1, 2017
0 comments Web development, Mozilla
In Firefox it's really easy to switch Tracking Protection on and off. I usually have it off in my main browser because, as a web developer, it often gives me an insight into what others would see and that's often helpful.
Tracking Protection as a means for performance boost as been mentioned many times before to not just avoid leaving digital footprints but also a way to browse faster.
An Example of Performance
I just wanted to show such an example. In both examples I load a blog post on seriouseats.com which has real content and lots of images (11 non-ad images, totalling ~600KB).
First, without Tracking Protection
Next, with Tracking Protection
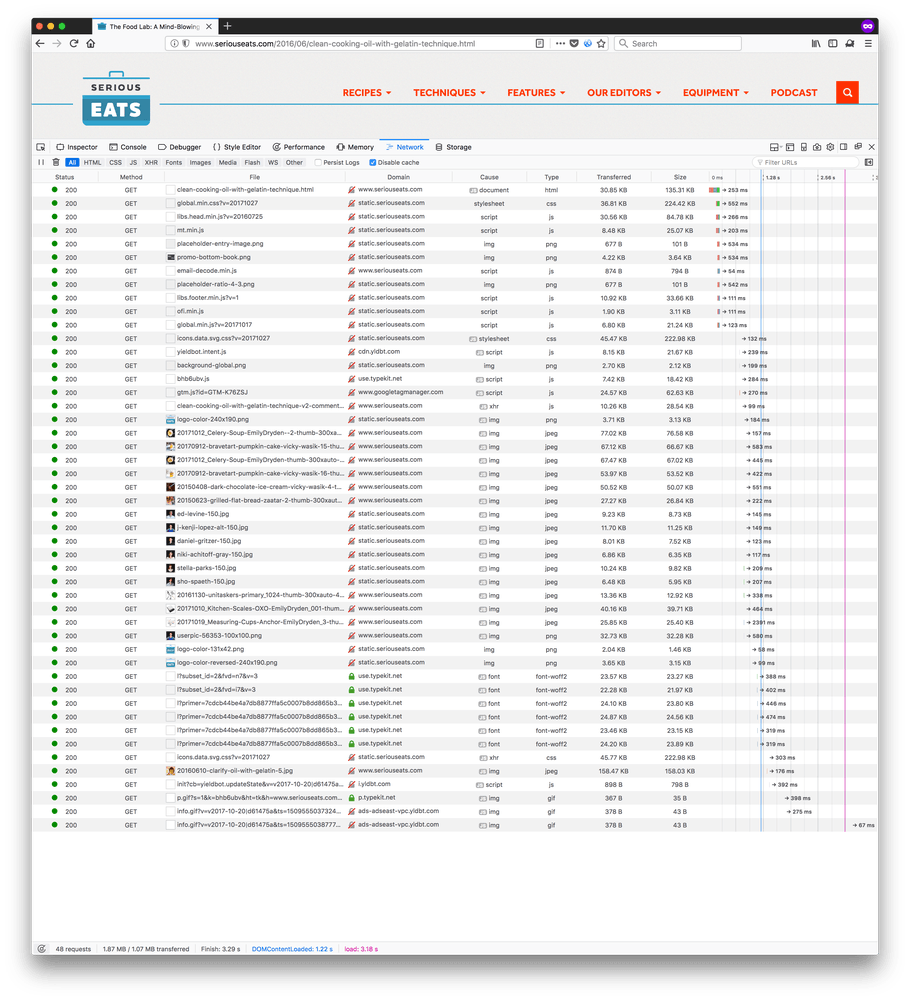
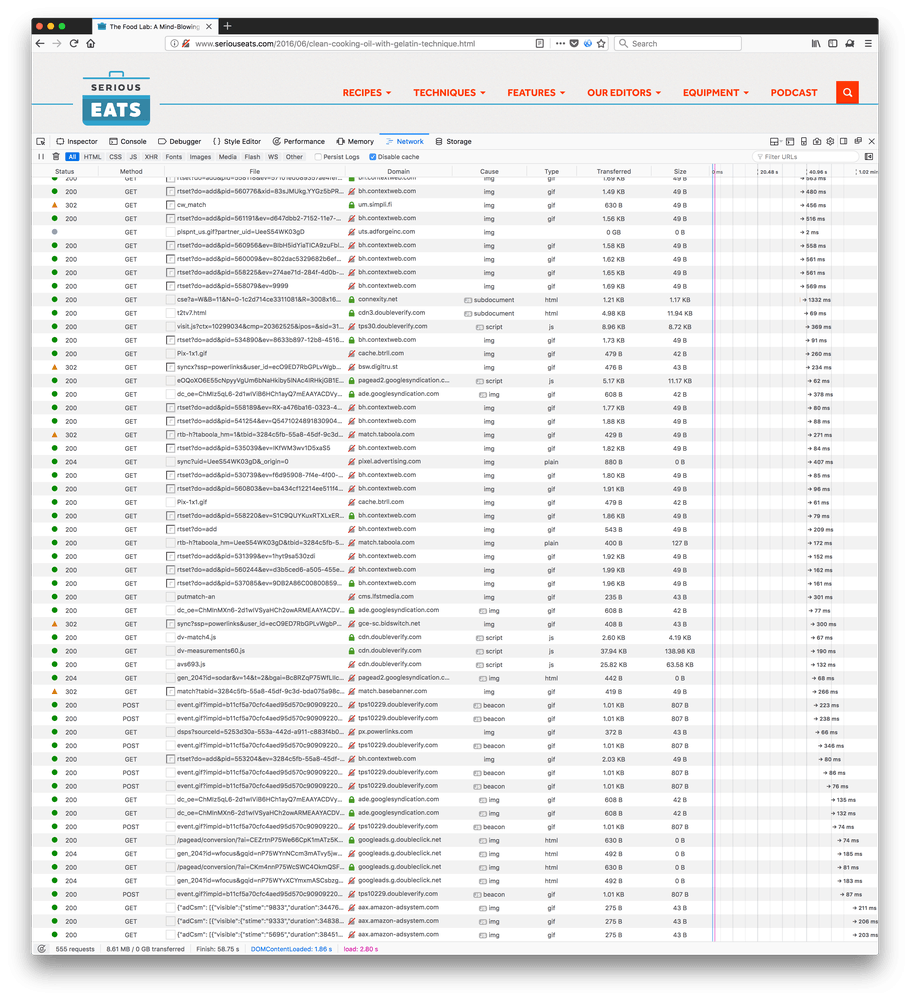
This is the Network waterfall view of all the requests needed to make up the page. The numbers at the very bottom are the interesting ones.
Without Tracking Protection
- 555 requests
- 8.61MB transferred
- Total loading time 59 seconds
With Tracking Protection
- 48 requests
- 1.87MB transferred
- Total loading time 3.3 seconds
It should be pointed out that the first version, without Tracking Protection, actually is document complete at about 20 seconds. That means that page loading icon in the browser toolbar stops spinning. That's because internally it starts triggering more downloads (for ads) by JavaScript that executes when the page load event is executed. So you can already start reading the main content and all content related images are ready at this point but it's still ~30 seconds of excessive browser and network activity just to download the ads.
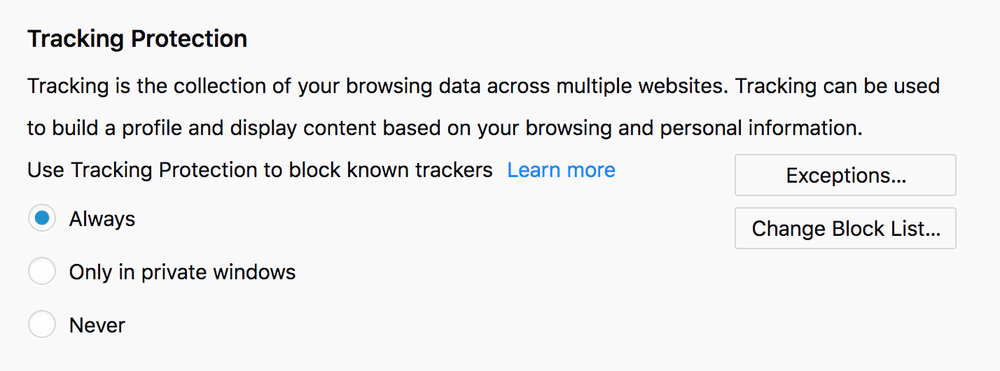
Enabling Tracking Protection in Firefox is really easy. It's not an addon or anything else that needs to be installed. Just click Preferences, then click the Privacy & Security tab, scroll down a little and look for Tracking Protection. There choose the Always option. That's it.
Discussion
Tracking Protection is big and involved topic. It digs into the realm of privacy and the right to your digital footprint. It also digs into the realm of making it harder (or easier, depending on how you phrase it) for content creators to generate revenue to be able to keep create content.
The takeaway is that it can mean many things but for people who just want to browse the web much much faster it can be just about performance.
Mozilla Symbol Server (aka. Tecken) load testing
September 6, 2017
0 comments Python, Web development, Django, Mozilla
(Thanks Miles Crabil not only for being an awesome Ops person but also for reviewing this blog post!)
My project over the summer, here at Mozilla, has been a project called Mozilla Symbol Server. It's a web service that uploads C++ symbol files, downloads C++ symbol files and symbolicates C++ crash stacktraces. It went into production last week which was fun but there's still lots of work to do on adding beyond-parity features and more optimizations.
What Is Mozilla Symbol Server?
The code name for this project is Tecken and it's written in Python (Django, Gunicorn) and uses PostgreSQL, Redis and Celery. The frontend is entirely static and developed (almost) as a separate project within. The frontend is written in React (using create-react-app and react-router). Everything is run as Docker containers. And if you ask me more details about how it's configured/deployed I'm afraid I have to defer to the awesome Mozilla CloudOps team.
One the challenges I faces developing Tecken is that symbol downloads need to be fast to handle high volumes of traffic. Today I did some load testing on our stage deployment and managed to start 14 concurrent clients that bombarded our staging server with realistic HTTPS GET queries based on log files. It's actually 7 + 1 + 4 + 2 concurrent clients. 7 of them from a m3.2xlarge EC2 node (8 vCPUs), 1 from a m3.large EC2 node (1 vCPU), 2 from two separate NYC based DigitalOcean personal servers and 2 clients here from my laptop on my home broadband. Basically, each loadtest script process got its own CPU.
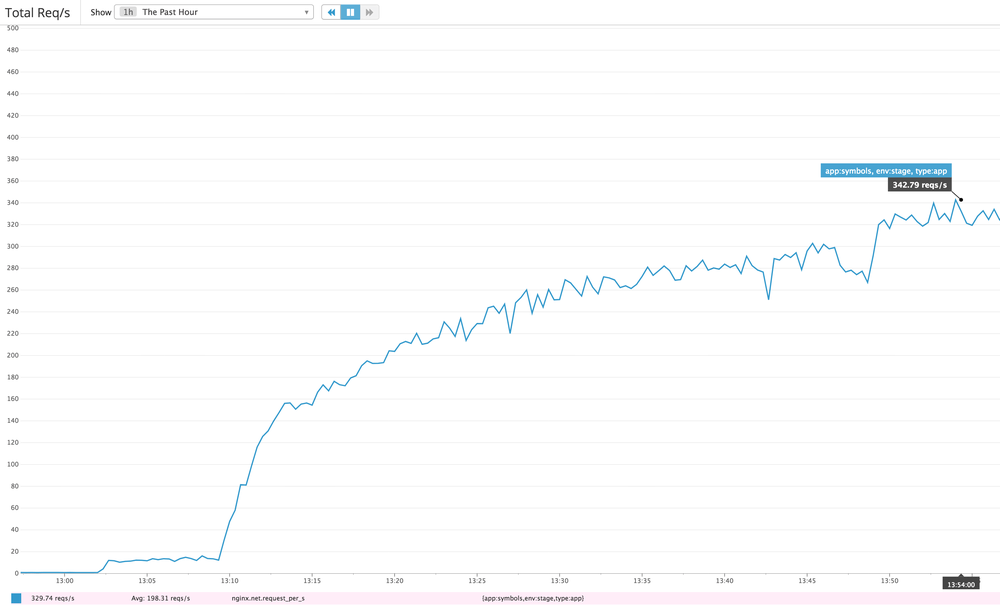
It's hard to know how much more each client could push if it wasn't slowed down. Either way, the server managed to sustain about 330 requests per second. Our production baseline goal is to able to handle at least 40 requests per second.
After running for a while the caches started getting warm but about 1-5% of requests do have to make a boto3 roundtrip to an S3 bucket located on the other side of America in Oregon. There is also a ~5% penalty in that some requests trigger a write to a central Redis ElastiCache server. That's cheaper than the boto3 S3 call but still hefty latency costs to pay.
The ELB in our staging environment spreads the load between 2 c4.large (2 vCPUs, 3.75GB RAM) EC2 web heads. Each running with preloaded Gunicorn workers between Nginx and Django. Each web head has its own local memcached server to share memory between each worker but only local to the web head.
Is this a lot?
How long is a rope? Hard to tell. Tecken's performance is certainly more than enough and by the sheer fact that it was only just production deployed last week tells me we can probably find a lot of low-hanging fruit optimizations on the deployment side over time.
One way of answering that is to compare it with our lightest endpoint. One that involves absolutely no external resources. It's just pure Python in the form of ELB → Nginx → Gunicorn → Django. If I run hey from the same server I did the load testing I get a topline of 1,300 requests per second.
$ hey -n 10000 -c 10 https://symbols.stage.mozaws.net/__lbheartbeat__
Summary:
  Total:    7.6604 secs
  Slowest:  0.0610 secs
  Fastest:  0.0018 secs
  Average:  0.0075 secs
  Requests/sec: 1305.4199
...
That basically means that all the extra "stuff" (memcache key prep, memcache key queries and possible other high latency network requests) it needs to do in the Django view takes up roughly 3x the time it takes the absolute minimal Django request-response rendering.
Also, if I use the same technique to bombard a single URL, but one that actually involves most code steps but is definitely able to not require any slow ElastiCache writes or boto3 S3 reads you I get 800 requests per second:
$ hey -n 10000 -c 10 https://symbols.stage.mozaws.net/advapi32.pdb/5EFB9BF42CC64024AB64802E467394642/advapi32.sy
Summary:
  Total:    12.4160 secs
  Slowest:  0.0651 secs
  Fastest:  0.0024 secs
  Average:  0.0122 secs
  Requests/sec: 805.4150
  Total data:   300000 bytes
  Size/request: 30 bytes
...
Lesson learned
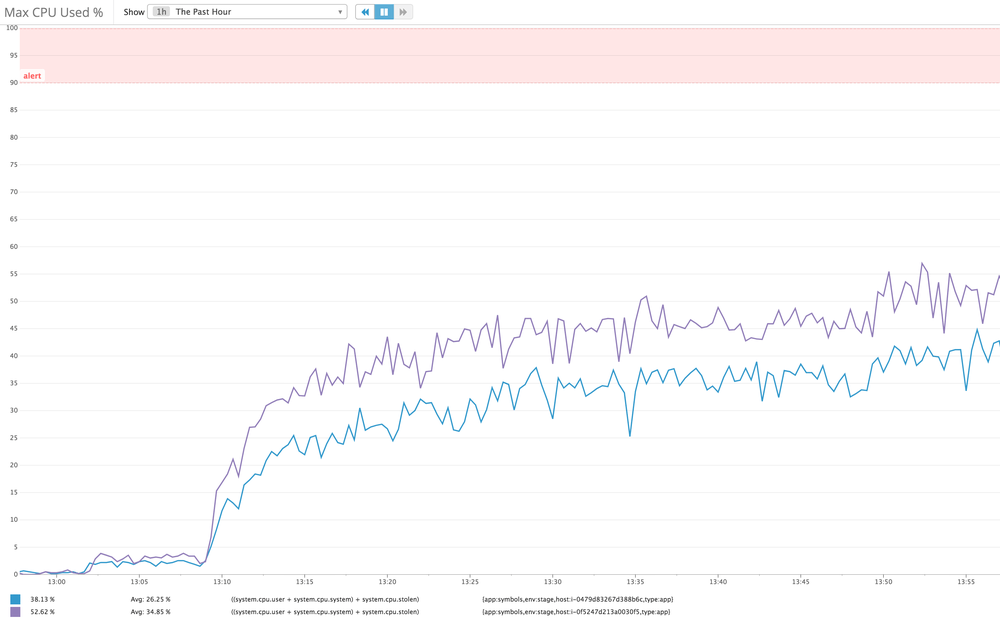
It's a recurring reminder that performance is almost all about latency. If not RAM or disk it's networking. See the graph of the "Max CPU Used" which basically shows that CPU of user, system and stolen ("CPU spent waiting for the hypervisor to service another virtual CPU") never sum totalling over 50%.